2.1.2 DESIGN CHANGE STUDY
2.1.2.1 PROBLEM RANKINGS
Inland Fisher Guide's Signal Lighting Division has released a document of tables entitled "1990 Design Change Study of Cost and Time Impact." Nine problem areas are identified in terms of quantity, money, and delay. The tables are a tabulation of the number, types, and costs of engineering changes (EC) required of a design once the design is officially released for production.
While some of the design changes could not have been anticipated, most of the problems could have been seen with the benefit of the perfect vision of hindsight. The original intent of the Plastic Injection Molding Expert System was to provide that perfect vision; to reduce or eliminate post-manufacturing design changes by evaluating a CAD design for potential manufacturability problems. The evaluation, as conveyed to the part designer, was to be based on published standards and the expertise of a molding expert.
When comparing the numbers against those of the previous year, the trend is favorable, with a total engineering change quantity decrease of 27.5% and a total cost decrease of 24%. There were, however, substantial increases in change requirements in categories concerning sink, heat distortion, and indexing and positioning change requirements.
Table 1 lists the nine top problems and indicates quantity, total cost (normalized by the lowest ranking quantity for the propriety of GM), and total time ranked by total cost. This same table is represented by Figure 1. Error descriptions are included below in Section 2.1.2.2. As can be seen, in terms of total cost, the top three problems are drafting and design errors, venting, and heat distortion.
Table 1 Total Cost and Time of Design Change Categories, Ranked by Total Cost
Normalized
Problem Quantity Total Cost Total Time
Drafting and Design errors 46 $11.40 722.0
Vent changes for lamp seal 11 5.33 270.5
Heat distortion 6 4.43 336.0
Light piping 2 3.47 101.0
Indexing and Positioning 17 3.37 177.5
Sink removal 3 1.98 45.5
Design interferences 8 1.69 110.0
Approval marking errors 5 1.12 38.5
Tuning requirements 5 1 21.5
Figure 1 through Figure 5 assist in a Pareto analysis of molding problems in terms of total cost, quantity, average cost, total time, and average time. The Pareto analysis helps to prioritize which problems are to be attacked first, but the different views provided by the different rankings lead to different priorities. Generally, the purpose is to eliminate the roots causes within a problem category, so that the total cost or time can be eliminated.
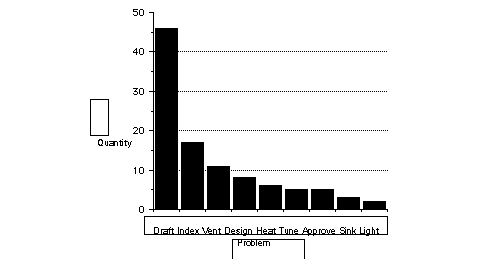
Figure 2 indicates that based on quantity alone, drafting problems should receive the most attention. As an aside, however, note how the priorities change if we look at the situation in terms of the cost to build a system to automatically detect and prevent such problems. Assuming that there is one solution per problem, there are forty-six different solutions required to eliminate the drafting and design errors and three solutions required to solve the sink removal problems. Also assuming that these totals correlate to the number of problems to be expected in the given category, it would be easier and quicker to create a system to detect sink problems rather than drafting problems. Stated quite simply, the complexity of the tool matches the complexity of the problem.
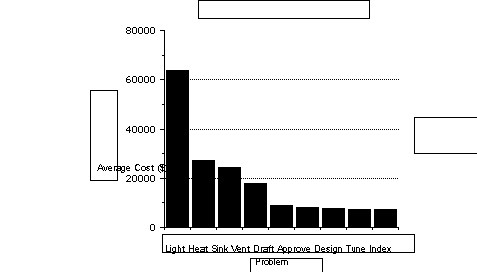
Figure 3 prioritizes the problems based on the average cost per problem. In this case, the top three problems are those of light piping, heat distortion, and sink removal.
Figure 1 Design Problems Ranked by Total Cost

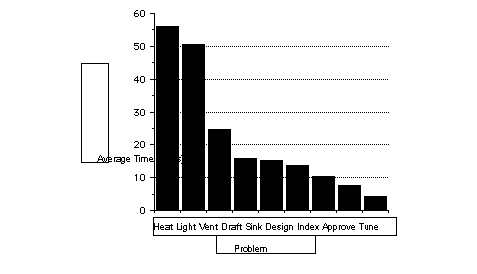
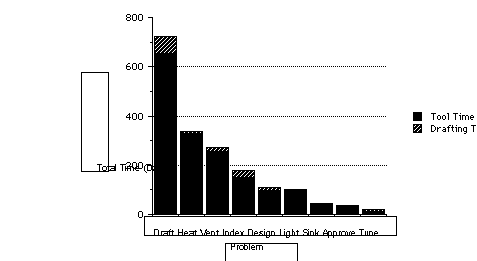
If the main concern is rapid product realization, then turnaround time for design changes must be considered. Figure 4 illustrates problem categories ranking in terms of total time while Figure 5 ranks the categories according to average time. Drafting errors are by far the most costly in terms of total time while heating, light, and vent hole problems take up the most time on a per-item basis.
Assuming the presence of an individual solutions per problem as above, the average time, rather than total time is also effective in determining priorities because, given the availability of more than one designer, the reiteration of multiple designs can be assumed to be achieved concurrently rather than sequentially.
For example, while drafting and design errors have a total time of 722, which would place the category at the top of the list, the 46 of them have an average turnaround time of 15.7 days which would place the category lower. Heat distortion problems have an average turnaround time of 56 hours, about four times that of sinks, and appearance of this problem would have more of an impact on the time it takes to get that product on the market.
Figure 2 Design Problems Ranked by Quantity

Figure 3 Design Problems Ranked by Average Cost

Figure 4 Design Problems Ranked by Tot
Figure 5 Design Problems Ranked by Average Time

 al Time